2010
| News | Registration | Abstracts | Accommodation | Excursions | Deadlines | Organizing committee |
| First circular | Participants | Abstract submission | Travel | Program | Seminar History | Contact us |
| Новости |
| Первый циркуляр |
| Регистрация |
| Оформление тезисов |
| Тезисы |
| Программа |
| Участники |
| Размещение |
| Экскурсии |
| Проезд |
| Важные даты |
| Оргкомитет |
| Обратная связь |
Uranium-bearing fluorite from the Perga Be deposit (Ukrainian Shield)
Lupashko T. N., Tarashchan A. N., Ilchenko E. A., Grechanovskaya E. E., Dersky L. S., Taran M. N., Vishnevsky A. A
N. P. Semenenko Institute of geochemistry, mineralogy and ore formation of National Academy of Sciences of Ukraine, Kiev, Ukraine
Ilchenko@igmof.gov.ua
Fluorite is one of the main fluorine-bearing minerals of apogranites and и genthelvine-phenakite feldspatic metasomatites (pertosites) from Perga Be-deposit (Volhynia block, Ukrainian Shield) (Bespal’ko, 1970). As established, the broad temperature and time ranged composition and structural variations of fluorite from rare-earth paragenesises resulted from variations of composition of the rock-forming fluids (Krasilshchikova et al., 1986, Lupashko et al., 2009).
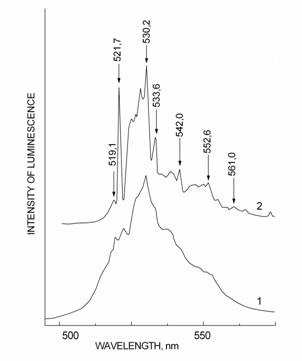
Photoluminescence (PhL) spectra of some crystals excited by UV-irradiation (l=365 nm) were scanned in the 400–700 nm range. The PhL spectra of initial and annealed at 1173 K (20 minutes) fluorite samples were recorded at 300 and 77 K (Fig. 1). For the first time the narrow radiation lines of U6+ (electron shell 5f1, electronic ground state 2F5/2) substituting Са2+ in the structural positions were observed. The charge compensation is found to be realized over 4O2-→4F- substitution mechanism (Tarashchan, 1978). It is assumed that primarily uranium enters the fluorite lattice as U3+.This assumption is consistent with the characteristic violet-red color of the samples studied.
Crystallization of U-fluorite, the phase of the late mineral association, took place at the end of metasomatic process when the residual fluorine- and carbon-bearing fluids enriched with uranium. U-fluorite formation is directly related to tectonic shoves in metasomatic substitution zones and formation of hydrothermal veins. The bright-green PhL of annealed samples suggests that there has been superposition of U-fluorite mineralization on earlier formed paragenesises. The resultant influence of U-fluids is the substitution of columbite by U-pyrochlore in the highly albitizated and silicificated aegirine apogranites (Buchinskaya and Nechaev, 1994).
Crystal chemical features of three morphologic varieties of U-fluorite from Perga metasomatites (nests of fluorite, a druse of cubic crystals in a crack and fine-grained quartz-fluorite veins) were investigated by infrared (IR) spectroscopy, proton nuclear magnetic resonance (1H NMR MAS), X-ray luminescence (RL) and X-ray diffraction..
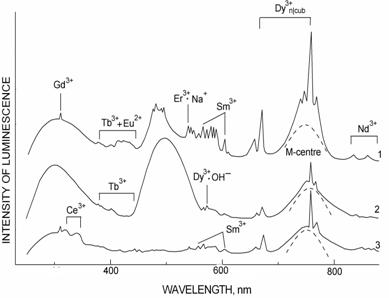
RL spectra of U-fluorites measured at 300 K in the range 200-1000 nm are shown in Fig. 2. In different samples different combinations and concentration of RL centers as Er3+·Na+ (540,2 nm) (Fig. 2-1) and Mn2+ (480 and 550 nm) (Fig. 2-2) and Ce3+ (320 and 340 nm) (Fig. 2-3) were determined. The characteristic peculiarity of U-fluorites is a high concentration of the intrinsic structural centers – MA-center (2VF-), seen as 750 nm luminescence band.
IR-spectra of initial and annealed fluorite cleavage plates in the spectral range 700-8000 cm-1 were registered with Bruker IFS-66 FT IR spectrometer supplemented by an IR microscope. A series of absorption bands of different width and intensity were observed in the regions of 5000-5300 cm-1, 3800-3000 cm-1, 1650-1400 cm-1, 1100-1000 cm-1 and 850-900 cm-1 (Fig. 3) where pure fluorite has no absorption. A different character of the bands intensity variations in different zones of the same sample (Fig. 3-1, 2) evidences that they are due to several different inclusions. Thus, the bands at 1024 and 1095 cm-1 may be related to some silicate inclusion (Moenke, 1962-1966) and those at 1410 and 881 cm-1 – to [CO3]2- stretching and banding vibrations in some carbonate mineral (Moenke, 1962-1966). The very broad band at 3410 cm-1 with a shoulder at about 3200 cm-1, the band at 1645 cm-1 (Fig.3) and a very week broad band about 5200 cm-1 are respectively related to stretching, banding and combination vibrations of vacuolar water (Aines and Rossman, 1984). A weak decrease of water absorption bands intensity after annealing (673 K, 2 hours) is due to partial removal of water.
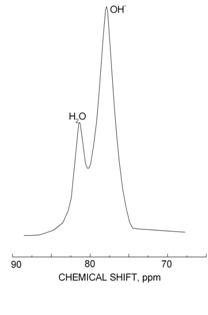
Amount of protons in structural OH-groups and vacuolar water in U-fluorite from druse of fluorite crystals in the crack was estimated by 1H NMR MAS spectra (Avance 400 spectrometer (Bruker)). As established, OH-groups strongly predominate over vacuolar water (Fig. 4). In the RL spectrum of this sample Dy3+·OH¯ lines are very distinct (Fig. 2-2).
Different morphological varieties of U-fluorite were investigated by DRON–2 diffractometer (CuKα- radiation). The scanning speed was 0, 25 degree/min. The measured U-fluorite unit cell dimensions (а) and substructure parameters (RCD - size of the coherent dispersion regions, ε – microstrain dimension and Р – the structure patchiness) are compiled in the Table. At the calculation of RCD dimension the physical broadening of 533 and 620 reflexes was taken into account (Sylyakov-Sherrer’s formula). As revealed, U-fluorite from the low-temperature quartz-fluorite vein has the lowest both unit cell parameter value (a) and degree of crystallinity. The unit cell dimension of U-fluorite crystals from the druse is close to that of standard fluorite (aetalon=5,4630, card № 88-2301, PCPDFWIN, PDF-2, 2001).
Table. U-fluorite structure parameters
|
Morphology |
a , nm |
V, nm3 |
ε= Δ а/ a |
RCD |
Р, % |
|
Nests |
5,4635 (1) |
163,084 |
9,1 • 10-5 |
5691 |
31,1 |
|
The crystals druse |
5.4632 (1) |
163.062 |
3.66 • 10-5 |
9791 |
25,2 |
|
Quartz-fluorite vein |
5,4580(1) |
162,595 |
9,16 • 10-4 |
1913 |
43 |
Different degrees of structural imperfection and hydration of U-fluorite morphological varieties are caused by the heterovalent isomorphism processes of different elements, including uranium.
|
|
|
|
Fig. 1. PhL spectra of U-fluorite at 300 (1) and 77 (2) K. |
Fig. 3. IR spectra of different points (1, 2) of U-fluorite nest cleavage plates at 300 K. *– parasitic bands.
|
|
|
|
|
Fig. 2. RL spectra of U-fluorite at 300 K: 1 – nest; 2 – druse of cubic crystals in crack and 3 – fine-grained quartz-fluorite vein.
|
Fig. 4. 1H NMR MAS spectrum of druse of U-fluorite crystals in crack. |
References
Bespal’ko N.A. Petrology and accessory minerals of granites and metasomatites of the North Volhynia. Kyiv: Nauk. Dumka, 1970. 164 p. (in Ukrainian).
Buchinskaya K.M., Nechaev C.V. Tantalum-niobium mineralization of Perga ore node. (Ukrainiane Shield) // Mineral. Journ. 1994. 16, №1. С. 15-29 (in Russian).
Krasilshchikova O.A., Taraschan A.N., Platonov A.N. Coloration and luminescence of natural fluorite. Kiev: Nauk. Dumka, 1986. 224 p. (in Russian).
Lupashko T. M., Ilchenko K.O., Kulchitskaya A.A., Shuriga T.M. Two genetic types of fluorite in rare-metal bearing rocks // Geochemistry and ore Formation. 2009. №5, №27. С. 77 – 80 (in Ukrainian).
Tarashchan A.N. Luminiscence of minerals. Kiev: Nauk. Dumka, 1978. 296 p. (in Russian).
Aines R.D., Rossman G.R. Water in minerals? A peak in the infrared // J. Geophys. Res. 1984. Vol.89. P. 4059–4071.
Moenke H. Mineral spektren. 1-11. Berlin. AkademieVerlag, 1962-1966.