2010
| News | Registration | Abstracts | Accommodation | Excursions | Deadlines | Organizing committee |
| First circular | Participants | Abstract submission | Travel | Program | Seminar History | Contact us |
| Новости |
| Первый циркуляр |
| Регистрация |
| Оформление тезисов |
| Тезисы |
| Программа |
| Участники |
| Размещение |
| Экскурсии |
| Проезд |
| Важные даты |
| Оргкомитет |
| Обратная связь |
Instrumental CSD measurements by 3D-tomography
Fomin I.S.*, Plechov P.Yu.*, Korost D.V.*, Noguchi S.**
*Faculty of Geology, Lomonosov’s MSU, Moscow
**Volcano Research Center, Earthquake Research Institute, University of Tokyo
Analysis of Crystal Size Distribution (CSD) is widely used for quantitative characteristic of textural and structural magmatic rock’s features. It is important, for example, in studying of magmatic melts crystallisation’s kinetiks [Marsh, 1998]. CSD plots are usually drawn in coordinates “natural logarithm of ratio of objects quantity to volume with them and characteristic length range” versus characteristic length. Nowadays for CSD measurements they use such methods as sifting for friable rocks, sequent sectioning and surface scanning, chemical or mechanical extraction and so on. Their main disadvantages are laboriousness, subjectivity of grain separation, rude approximation (or by simple geometric bodies) of grains boundaries and some other. These problems can result in considerable errors. Last years give us opportunity to get CSD from direct methods of 3D wave probing (scanning). One of the most promising is 3D X-ray microtomography. This work’s goal is estimation of method’s reliability and errors of measurement and data interpretation.
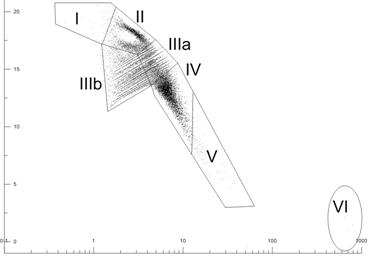
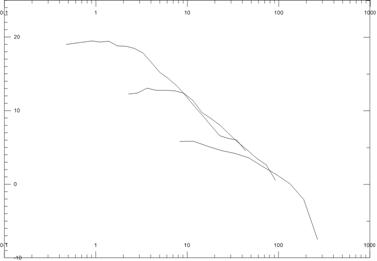
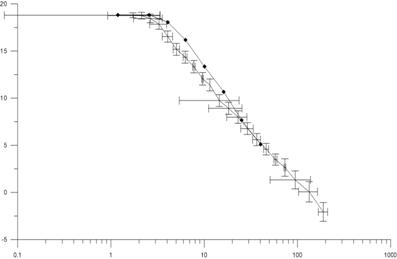
We have selected specimen with already estimated CSD [Noguchi et al., 2008] by traditional method of 2D sections analysis [Higgins, 2006]. For this specimen were perfomed several scans with different resolution on X-Ray SkyScan 1172 Microtomograph. We have used SkyScan CTAn software to extract information about surface squares and volume of 3D objects. On result plots (fig. 1, all plots are in CSD coords, described in previous paragraph) it is possible to define several zones by their reliability and relationship with noise. Maximum quantity of noise is in IIIb zone, and the most reliable zones are upper “tail” of II, IIIa, IV and V (if it is enough objects). After cutting off noises, which appears both during scanning and automated 3D-objects separation by CTAn software, data aggregation for crystal characteristic length ranges line CSD plot for each scan (fig. 2). Intervals of reliable data on horisontal and vertical axes were estimated by analysis geometrical specific features of objects separation and calculation. After chopping off parts with comparatively lower reliability and results interpolation we have plotted final CSD graph (fig. 3).
Comparasion of our data with results of traditional method [Noguchi et al., 2008] show us good agreement of plots and applicability of 3D X-ray microtomography method with our data correction method for direct CSD measurement in magmatic rocks. Differencies in data for length range 3-13 mkm can be explained by errors of non-direct CSD estimation drom flat images.
Method of 3D X-ray microtomography is much more faster, than traditional methods. It give us opportunity to measure volumes and sizes of objects directly from dataset, so we can estimate errors of data and get CSD for specimens with given reliable. This method is much more promising and prospective for CSD analysis, than other methods.
References:
Higgins M.D. Quantitative textural measurements in igneous and metamorphic petrology. New York: Cambridge University Press, 2006. 265 с.
Marsh B.D. On the Interpretation of Crystal Size Distributions in Magmatic Systems // Journal of Petrology, 1998, т. 39, н. 4., стр. 553-599.
Noguchi S., Toramaru A., Nakada S. Groundmass crystallization in dacite dykes taken in Unzen Scientific Drilling Project (USDP-4) // Journal of Volcanology and Geothermal Research, 2008, т. 175, стр. 71-81.
|
|
|
|
Fig. 1. Exaple of object processing by X-Ray SkyScan 1172 Microtomograph. I – zone of isolated objects, formed by several voxels. II – zone with to “tails” – zones with points density thickening. Lower tail is part of zone IIIb with small number of objects. IIIa – transitional zone between II and IV. IIIb – zone of quasiparallel stripes (result of data processing features). IV – zone of reliable narrow stripe of objects. V – zone with relatively small number of objects. VI – zone of isolated objects. |
Fig. 2. CSD plots for three X-Ray microtomographic scans. |
|
|
|
|
Fig. 3. Final CSD plot with error bars and CSD plot, estimated by [Noguchi, 2008] (line with circles). |
|